
For the second year running, we studied the boards and performance of Australia's 500 largest listed companies, the ASX500.
Executive Summary
Who are our women leaders?
The average age of women directors on ASX200 boards is 52.2, which is up slightly from last year’s average of 50.3.
More than one third of women directors on the ASX200 studied Commerce or Economics as part of their undergraduate degrees. New backgrounds we include this year include Pharmacy and Town Planning.
Women leaders on boards in the ASX500 include 307 director positions, and 10 chairman roles.
Where are they?
Women hold 9.5% of ASX500 board positions, up from 7.1% from last year. We identified 233 companies (47%) with women representatives on the board leaving 267 (53%) with no gender diversity. This is up significantly from last year when almost two thirds of companies had no women representation.
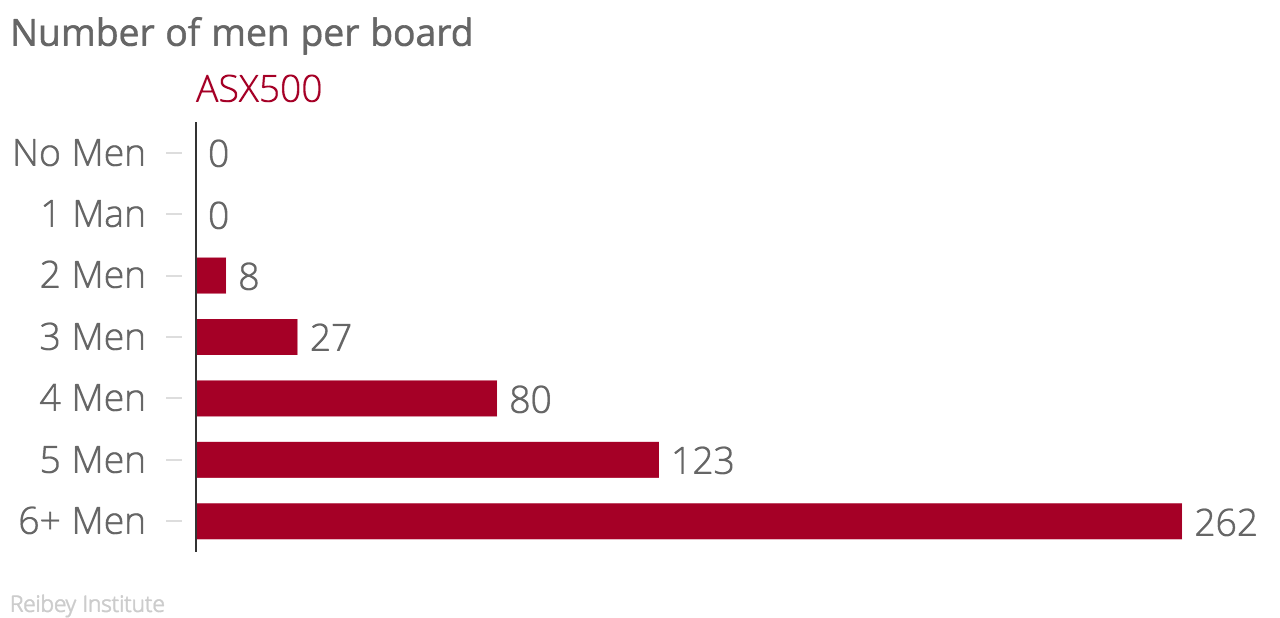
Over 250 companies have no women on their boards whilst more than 250 companies have 6 or more men.
The ASX500 as a market has 235 unique women holding 307 director positions. 20% of female directors serve on more than one board whilst 12% of their male counterparts serve on multiple boards.
Larger companies generally have more women on their board; however, there has been a marked increase in women representation over the last 12 months in the ASX400-500 band.
download the 2011 asx500 report
How are those companies performing?
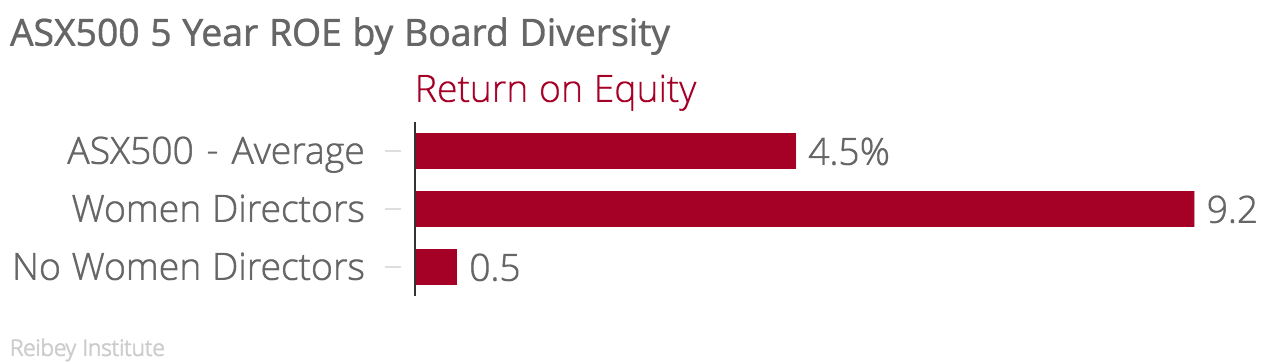
Companies with women on their board deliver a significantly higher Return on Equity (ROE) than those without women on their boards.

3 Year return on equity...
5 year return on equity...
Background
Gender diversity remains a key focus for many organisations, perhaps most notably the ASX500 which includes some of Australia’s largest and most influential companies. The Reibey Institute is proud to deliver this second annual research note on ASX500 Women Leaders which we hope is a positive and constructive contributor to our community achieving gender diversity. The 2011 research note builds on 2010 including key comparisons from twelve months ago and benchmarking against the male director population. Whilst we aspire and certainly have the capabilities to deliver a more comprehensive and broader research agenda, the Institute requires additional funding and in-kind support to take that step.

Who are our ASX Women Leaders
The Institute reviewed the biographies of the 112 women who serve on the boards of the ASX200 to understand more about these women than a raw number representation. In addition to the dataset from the Institute’s 2010 Research Note, the 2011 Report researched the additional women appointed to ASX200 board positions over the intervening period.
Professional Qualifications
Amongst the female directors reviewed, the most common area of study was once again in a business-related discipline of Commerce/Business or Economics. The popular areas of study remain unchanged, namely, Arts, Law and Science, noting the addition of Marketing, Town Planning and Pharmacy. There were also 39 women with Masters Degrees across disciplines such as; Business Administration, Law, Arts, Economics, Project Management, Environmental Science and Social Administration. Seven women hold a Doctorate.
We also note that at least 13 of these women have been recognised for their contribution to Australian society having received Australian Honours awards.
Age
The average age of female board members on the ASX200 is 52.2 years old, which has increased slightly in a year, up from 50.3.
The Institute has reviewed the Boards of the ASX500 and found that women hold 307 board positions or 9.5% of all directorship positions, up from 7.1% last year. The Institute identified 233 companies (47%), which have some level of female representation on their boards, leaving 267 companies or 53% with no gender diversity. This is up from almost two thirds of companies having no female representation last year.
The three sectors with the highest representation of females have not changed since last year;
1. Financials with 14.1% (last year 10.6%)
2. Healthcare with 13% (last year 10.1%)
3. Consumer Discretionary with 12.4% (last year 9.7%)
The lowest representation of women is in Materials (5.6%), Energy (6%) and Information Technology (7.5%). It should be noted that last year Utilities had less than 5% female representation and now has 9.3%, which is the highest proportional increase across all sectors.
Charts 3 and 4 break down the representation to a sector level. Chart 4 shows the change in number of companies with women on boards. All sectors have an increase in representation since the 2010 report.
Chart 5 shows the comparison of 2010 and 2011 in the number of companies with differing numbers of women on their boards. The chart shows that of the 233 companies that have women directors 63 of these or (12.6%) have more than one women. Chart 5a is the same chart showing number of women on boards vs men on boards for 2011.
Chart 5a shows the number of companies with different numbers of men and women on their boards. The highest number of men on one board is 15 and the smallest is 2. The highest number of women on a board is 4 with 267 companies having no female board representation. Over 250 companies have no women on their boards where more than 250 companies have 6 or more males. The average size of boards is 6.2 people.

Multiple Boards
ASX500 as a market has 235 unique women holding 307 positions.
Chart 6 compares the number of women serving on multiple boards for 2010 and 2011. In 2011 there are 48 women or (20% of female directors) serving on more than one board which includes 2 serving on 5, 4 serving on 4, 10 serving on 3 and 32 serving on 2. This is an increase in the number of women serving on multiple boards but a decrease in the proportion, which could be attributed to the increase in rate of women appointed overall.
We also found there were 41 women serving across sectors.
Chart 7 shows the number of director positions held by women in that sector versus the number of unique women serving on boards in that sector. The largest overlap can be seen in the Financials sector again this year, and the overlaps are seen in the larger sectors.


Market Capitalisation / Company Size
We looked at the breakdown of ASX listed companies by market capitalisation. Again this year, of the companies that had women on their boards the majority of these were in the larger companies. As the overall representation of women increases we expect that the weighting in the smaller companies will even out. However we note that the smallest 2 bands have an increase since last year.
Chart 8 shows the percentage of the women directors in each market capitalisation band by sector and the overall market. Note the difference between Healthcare where there is the largest representation outside the ASX200, compared to Telecommunication Services and utilities, which have no women outside the ASX200. As also found in the 2010 report, overall just more than 60% of women directors are in ASX200 companies.
Charts 9 and 10 show the number of ASX500 companies across the five market capitalisation bands with female board representation. Chart 9 shows number of companies with women and chart 10 shows the percentage of that sample of all companies. For example, in Chart 9 the Financials sector has the highest number of female directors in the ASX100 but chart 10 shows Telecommunications and Consumer discretionary have the highest percentage representation.

How are the companies with Women Leaders performing?
Previous studies, primarily in the United States, suggest that company leadership has a positive impact on the bottom line. The Reibey Institute’s 2010 report was the first of its type for the Australian market. The Institute has again examined this important relationship.
The analysis in question is isolated to the ASX500 over a three and five year time frame. The Institute has focused on Return on Equity (ROE) to examine financial performance, calculated as a simple average over a three and five year time frame. This is the second study of this relationship and over time the Institute would like to develop a broader time series study.
The ASX500 has been divided into two samples; companies with women on the board (WD; n=233 red bar) and companies without women on the board (NDW: n=267 blue bar). These samples are also examined across primary sectors.
The average ROE for the ASX500 over 3 years was 3% and for 5 years was 4.5% (green bar). This year again, the Institute has found that companies with female representation on their board outperformed the markets and companies with no gender diversity over the 3 and 5 year time period. There was an 8.7% difference over 5 year ROE (WD=9.2%, NWD=0.5%) and a 6.7% difference over 3 years (WD=6.7%, NWD=0%).
Following analysis of the ASX500 market, the Institute then divided each sample by primary sector to isolate sector-based performance discrepancies and to make what it considers to be a better like-for-like comparison [really?]. Chart 12 shows the difference in 3 and 5 year ROE for companies with female directors and those without, by sector (WD less NDW). A positive number suggests that companies with women directors have a higher ROE by the amount shown and a negative suggests a lower ROE. For example Industrials and Consumer discretionary companies with no gender diversity outperformed those with female board representation. All other sectors had outperformance when there was gender diversity on the board. These are consistent with the trends found last year.
It is important to note that the Institute is not suggesting a causal relationship. We are not suggesting that by appointing a female board member a company will automatically outperform as a direct result. There are many opinions on what the exact cause may be however this analysis is beyond the scope of this study.
Some suggestions have been…….. [delete?]


Methodology
The research in this report is based on Reibey analysis of Capital IQ, Company Websites and the ASX.
The sample is the ASX500 unless otherwise stated.
Three broad questions the report sought to investigate
1. Who are the women leading Australia’s largest listed companies
2. How and where are they serving
3. How are the companies they are leading performing
The Institute began by sampling the ASX500 as at 30 June 2011. S&P do not cover an ASX500. This list was the ASX200 + the next 300 largest companies by market cap as at 30 June 2011. We note that at 30 June the ASX was (and still is) experiencing significant volatility.
Financial data for the companies examined were obtained from Capital IQ. Capital IQ is a Standard & Poor's business that provides comprehensive fundamental and quantitative research and analysis solutions to over 4,200 financial institutions. This is a longitudinal and comprehensive database of financial information for companies all over the world. The Capital IQ database is recognized as a leading source for this type of information. For more information about Capital IQ, please visit their website at www.capitaliq.com.
Data about diversity and the women in the ASX500 was manually obtained by the Reibey Institute reviewing Chairman, Director, CEO and CFO biographies provided by CapitalIQ, Company Websites and the ASX . Our methodology further allows for comparability over time and across industries and geographies and forms the basis of a robust database.
Return on Equity (ROE)—ROE is calculated as a ratio of income (before extraordinary items) to average shareholder equity for the year. It is a composite measure that reflects the executive management team’s ability to balance the three pillars of corporate management: profitability, asset management, and Financial leverage. In this study, the ROE measures for each company represent the average of 3 and 5 year annual ROEs as at 30 June 2011. A simple average of the annual ROEs for the period shows the returns for the long-term, reducing the impact of any unusual year-to-year fluctuations. ROE explicitly measures company performance from the viewpoint of the shareholders. For example, a 20.0 percent ROE means $20 of net income was created for each $100 that was invested, measured at book value.